katzlabbrandeis
Date: August 09, 2023
Contributors: Abuzar Mahmood, abuzarmahmood
PR: https://github.com/katzlabbrandeis/blech_clust/pull/86
Bridging the Gap: Enhancing Channel Correlations with Blech Clust
In this blog post, we delve into an exciting pull request (PR) that has been recently made to the blech_clust repository. The PR titled “80 test for bridges channels” was created by contributor Abuzar Mahmood and includes noteworthy code enhancements to the blech_clust.py file. The primary aim of these changes lies in calculating correlations between raw data to check for bridged channels. Bridged channels, in this context, are essentially channels that may have been unintentionally linked or ‘bridged’ due to various reasons such as hardware issues or signal interference, leading to similar readings and reducing the effective number of independent channels.
The core of this PR lies in the scripts that have been added to calculate thresholds of correlation on raw data and the working code to test for bridging. The changes also include an update to sort data by channel number, a move aimed at organizing the data more efficiently. There’s also a simplification of thresholding and plotting of the correlation matrix. These changes span across five files with 286 additions and 1 deletion.
Technical Deep Dive
Correlation Calculation
The raw_channel_correlation_test.py file has seen significant additions. It now includes a new function intra_corr(X) that takes a 2D data array X and calculates a correlation matrix. This is done using the pearsonr function from scipy.stats, which calculates a Pearson correlation coefficient and the p-value for testing non-correlation. This mathematical approach is foundational for detecting linear relationships between pairs of channels, ultimately identifying potential bridged channels.
from scipy.stats import pearsonr
import numpy as np
from itertools import combinations

def intra_corr(X):
    inds = list(combinations(range(X.shape[0]), 2))
    corr_mat = np.zeros((X.shape[0], X.shape[0]))
    for i, j in inds:
        corr_mat[i, j] = pearsonr(X[i, :], X[j, :])[0]
        corr_mat[j, i] = corr_mat[i, j]
    return corr_mat
Threshold Calculation
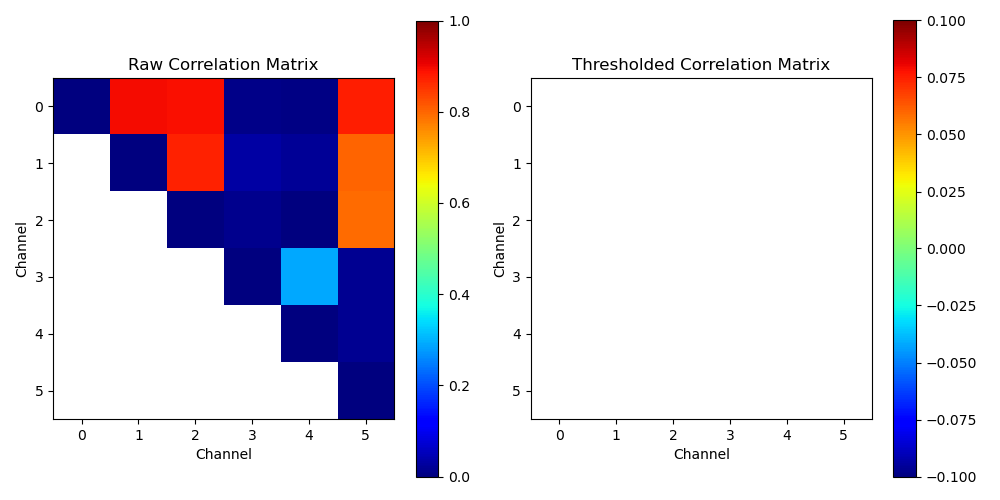
The correlation matrix is then used to identify potentially bridged channels. If the correlation between two channels is too high, it suggests that they might be bridged. The PR also introduces scripts to calculate thresholds of correlation on raw data, which are instrumental in identifying such anomalies. This is achieved by determining the percentile thresholds of the flattened correlation matrix, allowing for a customizable sensitivity setting based on different percentile levels.
thresh_percentile = [np.round(np.percentile(flat_corr_list, x*100), 3) for x in thresh_list]
Data Sorting and Visualization Enhancements
Moreover, the PR improves data handling by sorting the data by channel number. This organizational enhancement ensures that the data is easier to navigate and analyze. Additionally, the simplification of thresholding and the plotting of the correlation matrix make it more intuitive for users to visualize and interpret the data. These improvements are crucial for researchers dealing with large datasets where clarity and efficiency are paramount.
Impact and Future Directions
The impact of these changes is potentially far-reaching. By enabling the detection of bridged channels, the code can help improve the accuracy of data analysis. It can also help in identifying potential hardware issues or signal interference that might be causing the bridging, thereby allowing for necessary corrective measures. This PR is another step forward in driving the robustness and reliability of the blech_clust repository. It exemplifies the continuous efforts by the contributors to improve and enhance the codebase.
Looking ahead, future contributions could focus on extending these methods to accommodate non-linear correlations, integrating machine learning algorithms for anomaly detection, or expanding the visualization tools to include more comprehensive data interaction capabilities. We look forward to seeing more such enriching contributions in the future.