katzlabbrandeis
Date: January 11, 2024
Contributors: abuzarmahmood, Abuzar Mahmood
PR: https://github.com/katzlabbrandeis/blech_clust/pull/138
Unveiling Clustering Stability: Hierarchical Clustering Plot for Better Assessment
Introduction
The recent pull request to the ‘blech_clust’ project on GitHub introduces a significant enhancement in cluster stability assessment. By incorporating a hierarchical clustering plot for each clustering solution on every electrode, it provides a clearer visualization of the underlying features of each cluster. This new approach offers an improved method for analyzing cluster stability, which is crucial for researchers, especially in fields like neuroscience.
Key Technical Aspects of the Changes
The pull request primarily modified three files: ‘blech_clust.py’, ‘blech_post_process.py’, and the newly added ‘utils/cluster_stability.py’. The addition of the latter file is pivotal as it contains the core functionality for hierarchical clustering.
Detailed Code Changes
-
In ‘blech_clust.py’:
A new line was added to automate the execution of the ‘cluster_stability.py’ script, enhancing usability and ensuring that the clustering stability analysis is seamlessly integrated into existing workflows.+ f.write('python $BLECH_DIR/utils/cluster_stability.py $DATA_DIR $ELECTRODE_NUM \n') -
In ‘blech_post_process.py’:
Several import statements were removed, indicating a more efficient use of libraries and possibly reducing dependencies, which can lead to faster execution times and lower memory usage. -
In ‘utils/cluster_stability.py’:
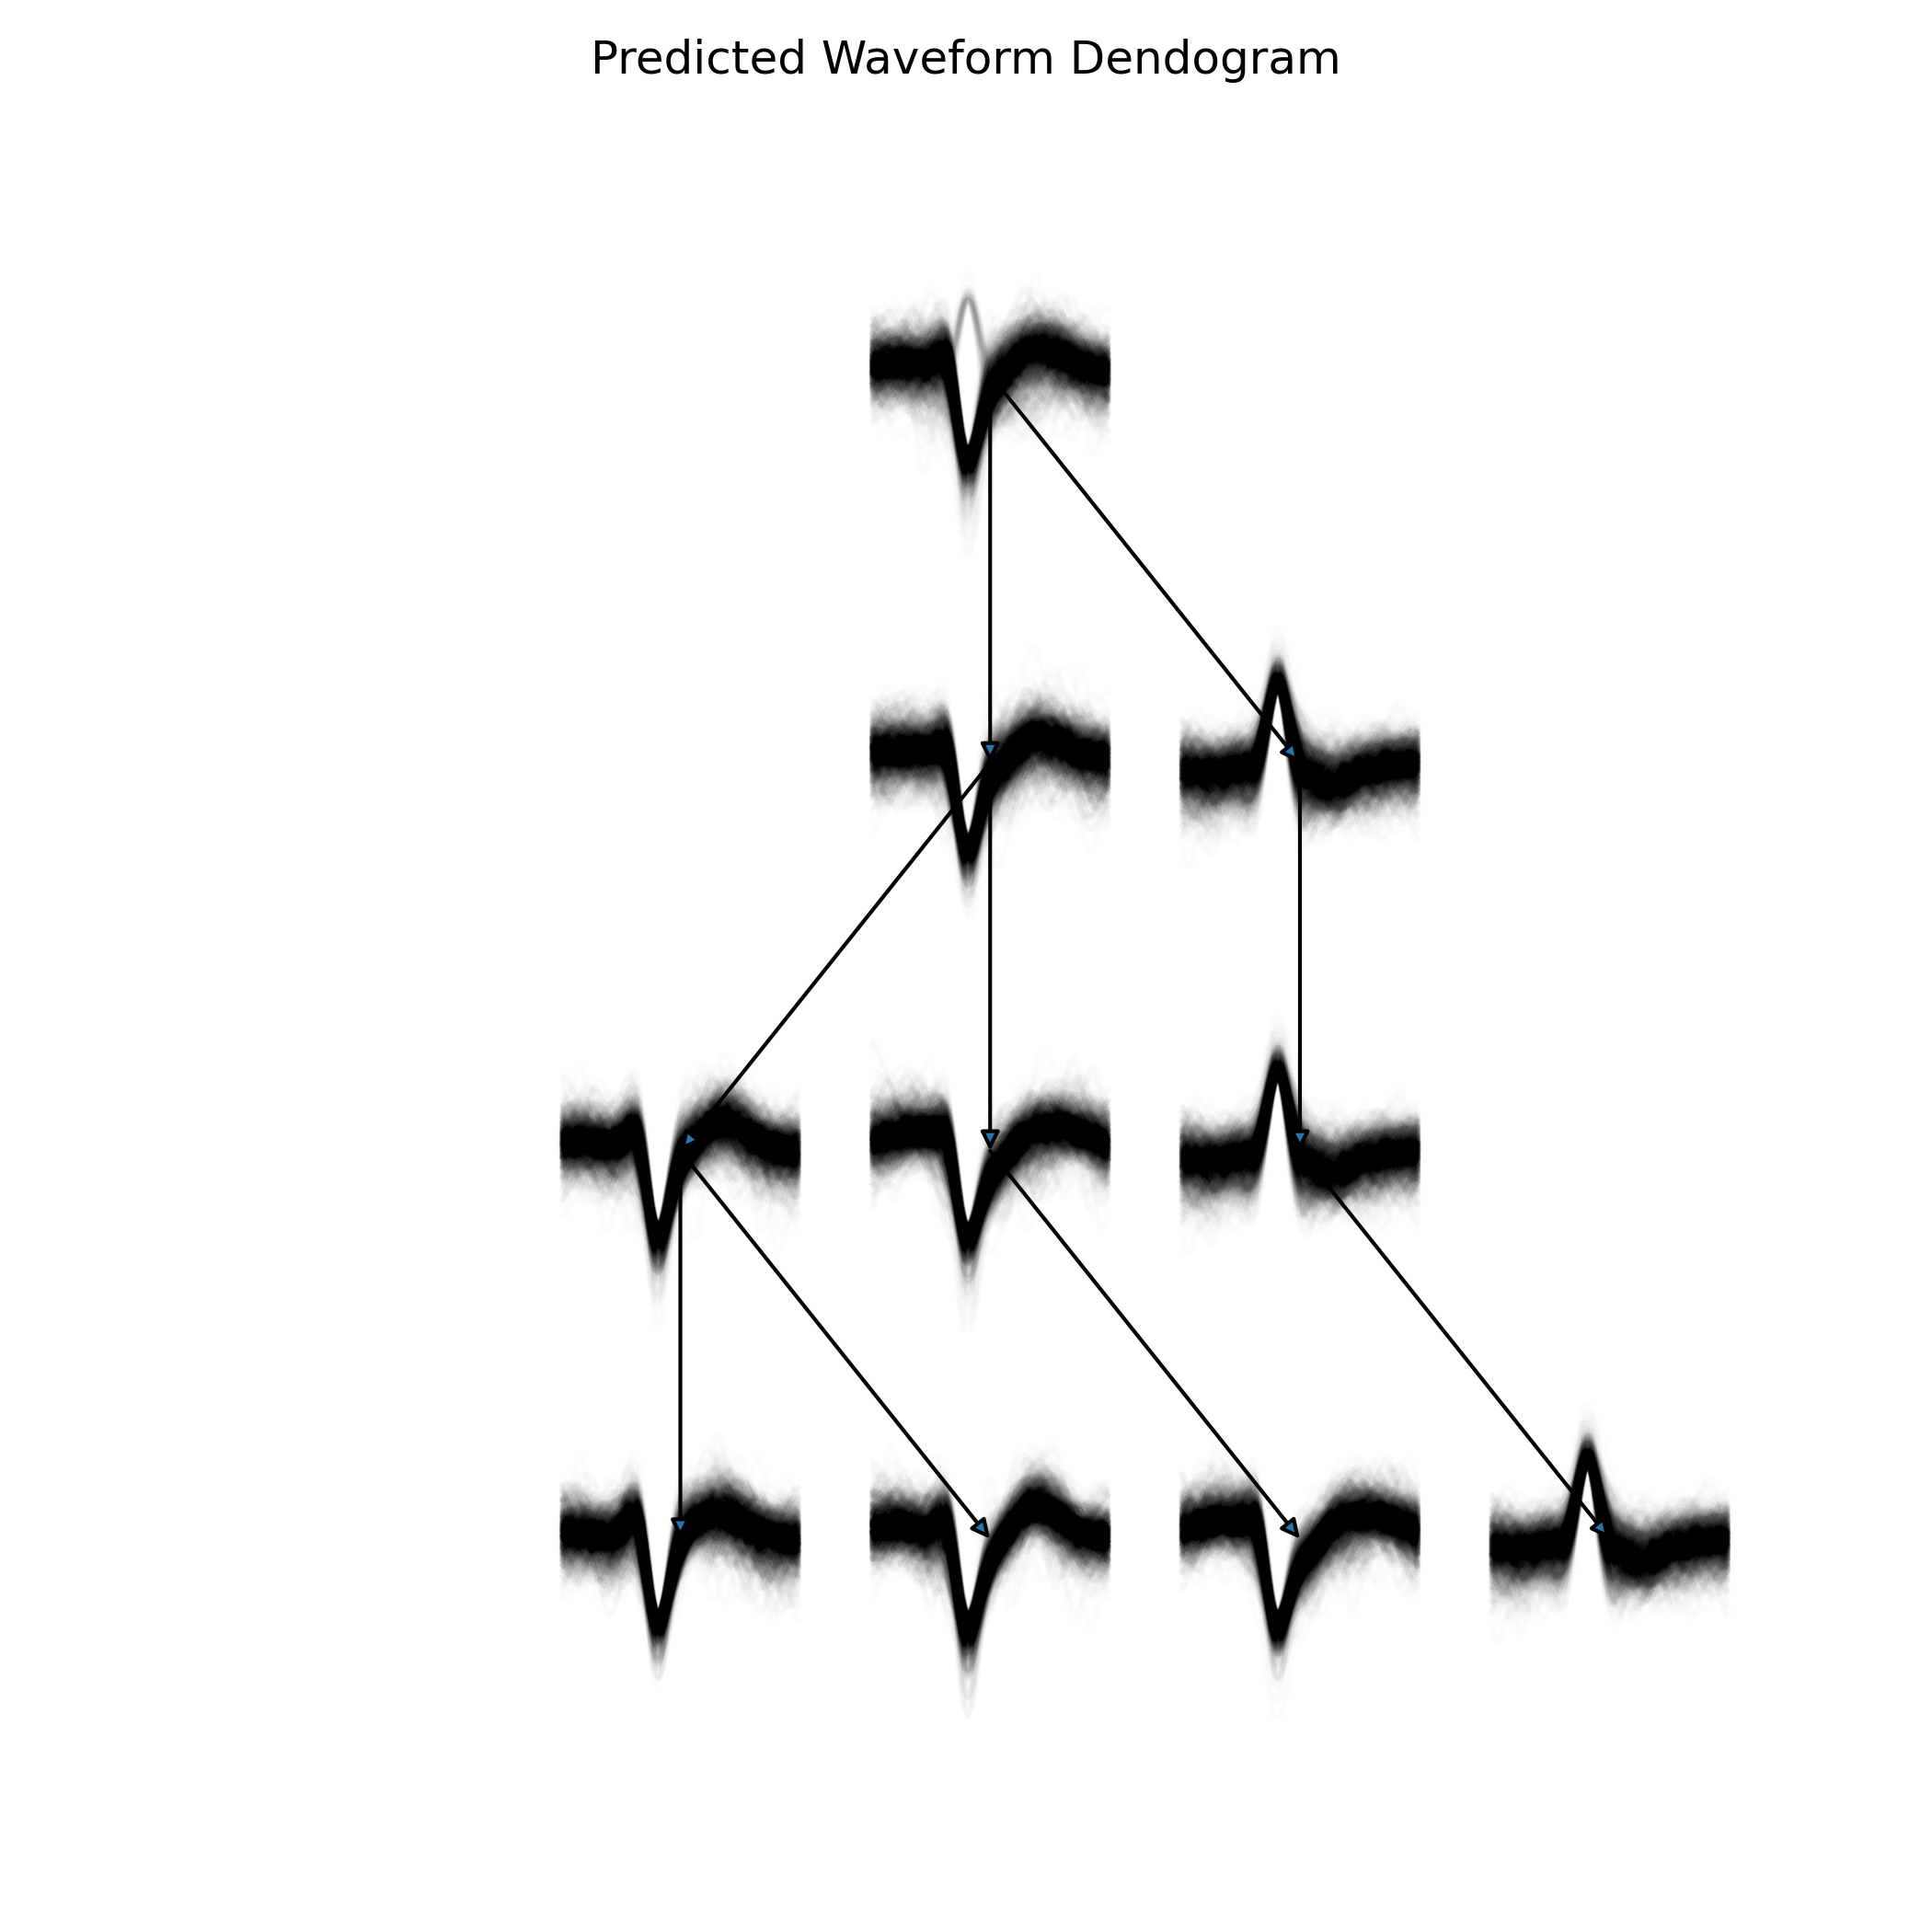
This script is the crux of the update, tasked with performing hierarchical clustering on electrode data. It generates two key visualizations for each clustering solution: a dendrogram and a color-coded plot of clusters.Here’s a snippet from ‘cluster_stability.py’:
# Perform hierarchical clustering on spike features
clust_dat = np.hstack((pca_slices, energy, amplitudes))
feature_names = [f'PC{x}' for x in range(pca_slices.shape[1])]
This code combines principal component analysis (PCA) slices with energy and amplitude metrics into a unified dataset for clustering, ensuring that the most relevant features are utilized.
New Section: Understanding Hierarchical Clustering
Hierarchical clustering is a method of cluster analysis which seeks to build a hierarchy of clusters. In the context of this update, it provides a comprehensive view of data structure by breaking down datasets into nested clusters.
Key Concepts:
- Dendrogram: A tree-like diagram that records the sequences of merges or splits. It visually represents the arrangement of the clusters produced by hierarchical clustering.
- Agglomerative Approach: This bottom-up approach starts with each element as a single cluster and merges them into larger clusters, ending with a single cluster encompassing all elements.
- Linkage Criteria: Determines the distance between sets of observations, influencing how clusters are formed. Common methods include single, complete, and average linkage.
Impact and Benefits of the Changes
The hierarchical clustering plot introduced in this update enhances the ‘blech_clust’ project by providing users with better tools to understand cluster stability. This is especially important in neuroscience, where data interpretation can be complex and nuanced.
Benefits:
- Enhanced Visualization: The dendrogram offers an intuitive understanding of the hierarchical structure, while the color-coded plot aids in the quick identification of distinct clusters.
- Improved Analysis: Researchers can now assess the robustness of clusters more effectively, potentially leading to more accurate scientific conclusions.
- Streamlined Workflow: By automating the generation of these plots, users can seamlessly integrate this analysis into their existing data processing pipelines.
Conclusion
The enhancements introduced in this pull request are a testament to how visualization tools can significantly improve the analysis of complex datasets. By providing a more transparent view of data clusters, researchers and scientists are empowered to perform more precise analyses, ultimately leading to more reliable results. This advancement represents a substantial step forward in the evolution of the ‘blech_clust’ project, reinforcing its utility in scientific research.